Statistics & results
What is the difference between User Statistics and Results?
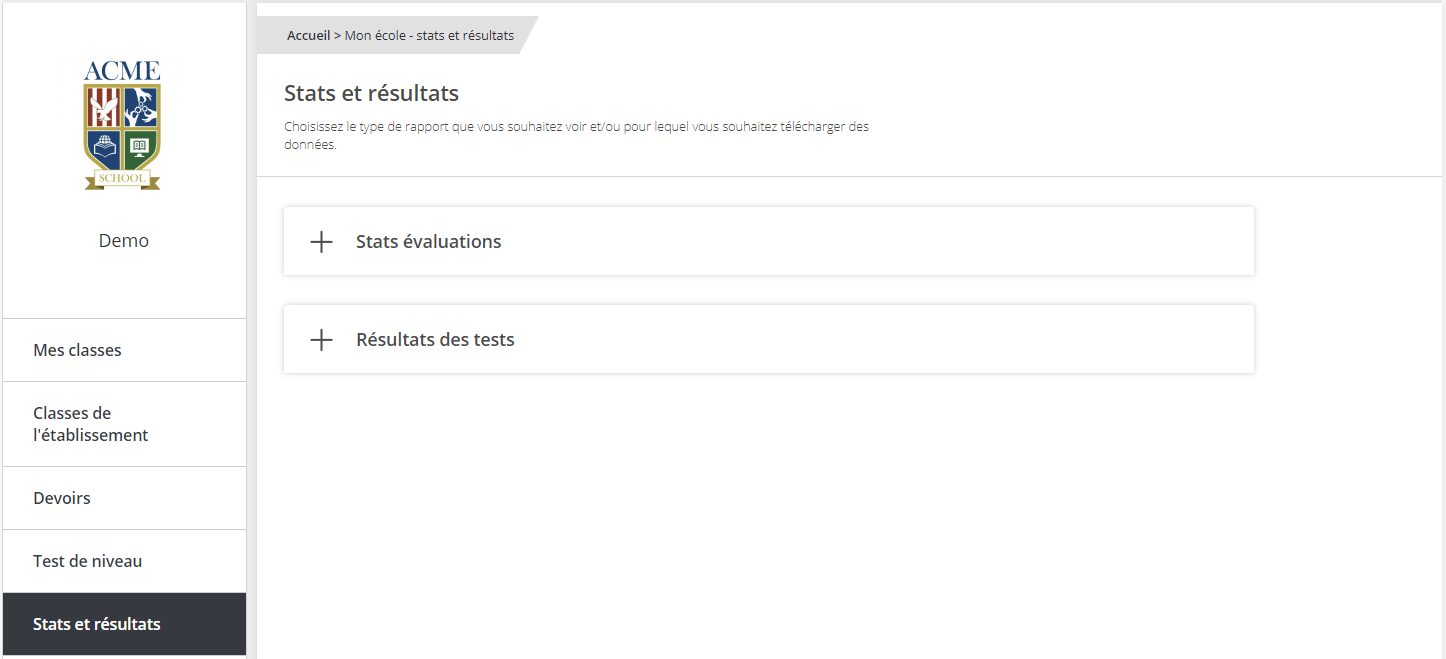
On the Statistics and Results page in your My School menu (web), the Results section enables you view your students' assignment results and download site usage statistics. This data can be exported, for any specific desired time period, in .csv format. On the site itself, you can choose to view results for a student, a class, or all your classes.
The downloadable Usage Statistics report, in .csv format, shows all of the site activity of your students and, therefore, their learning frequency. The data available includes the date of account creation; the date of the last learning session; the number of log-ins over a given time period; the number of learning units played; and the time spent on the platform. On the site, the statistics can be viewed on three levels: all classes, a specific class, and a specific student.
How can I track the progress of my classes?
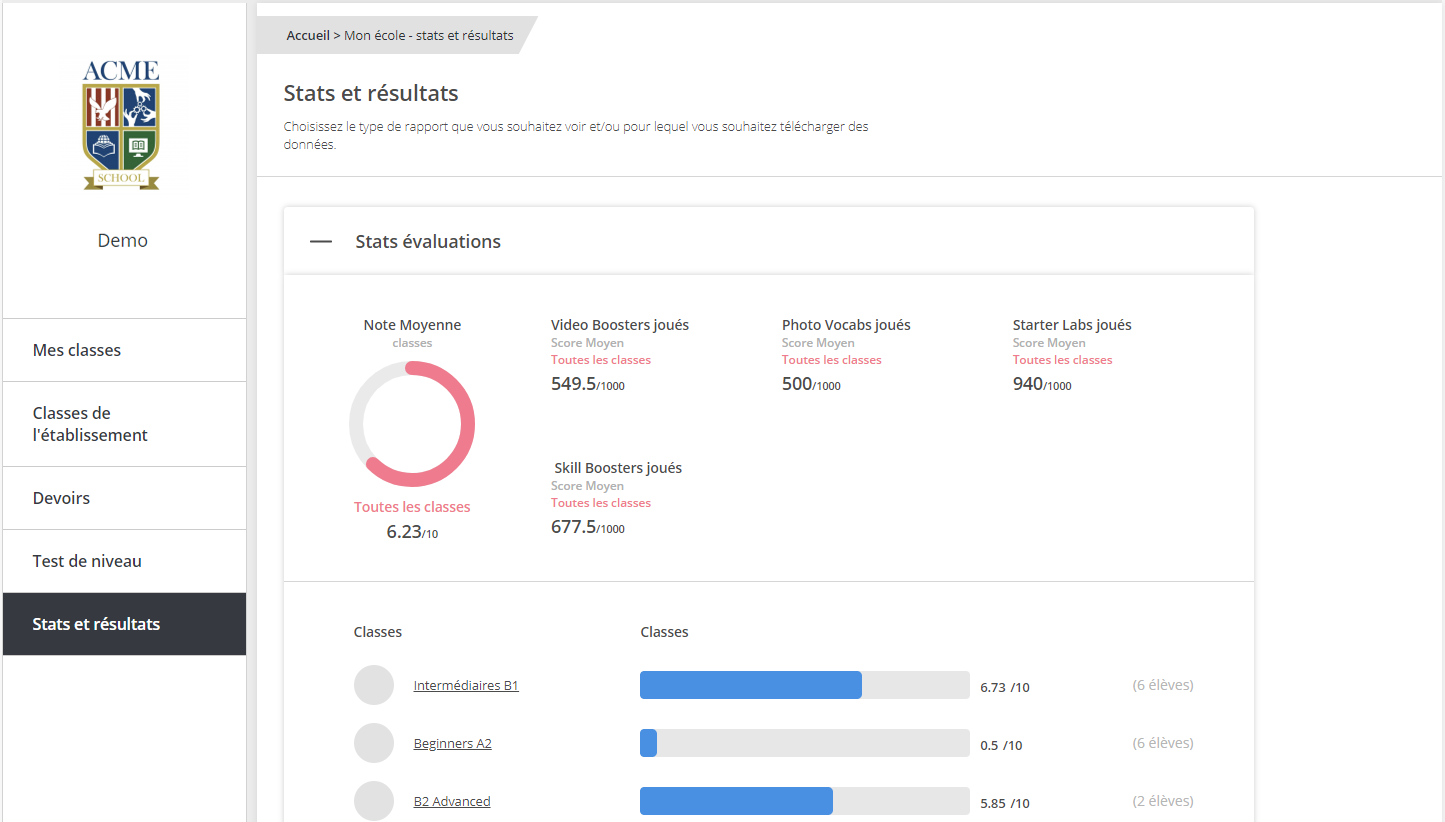
The data available on the Statistics and Results page are shown on three levels: all classes, a single class, and a single student.
The Statistics evaluation section first shows the average assignment result for all your classes, as well as the average for learning units played. You can also compare performance between classes with the averages presented as a score over 10.
If you'd like to know the progress of just one class, click here.
If you'd like to know the progress of just one student, click here.
How can I track the progress of a class?
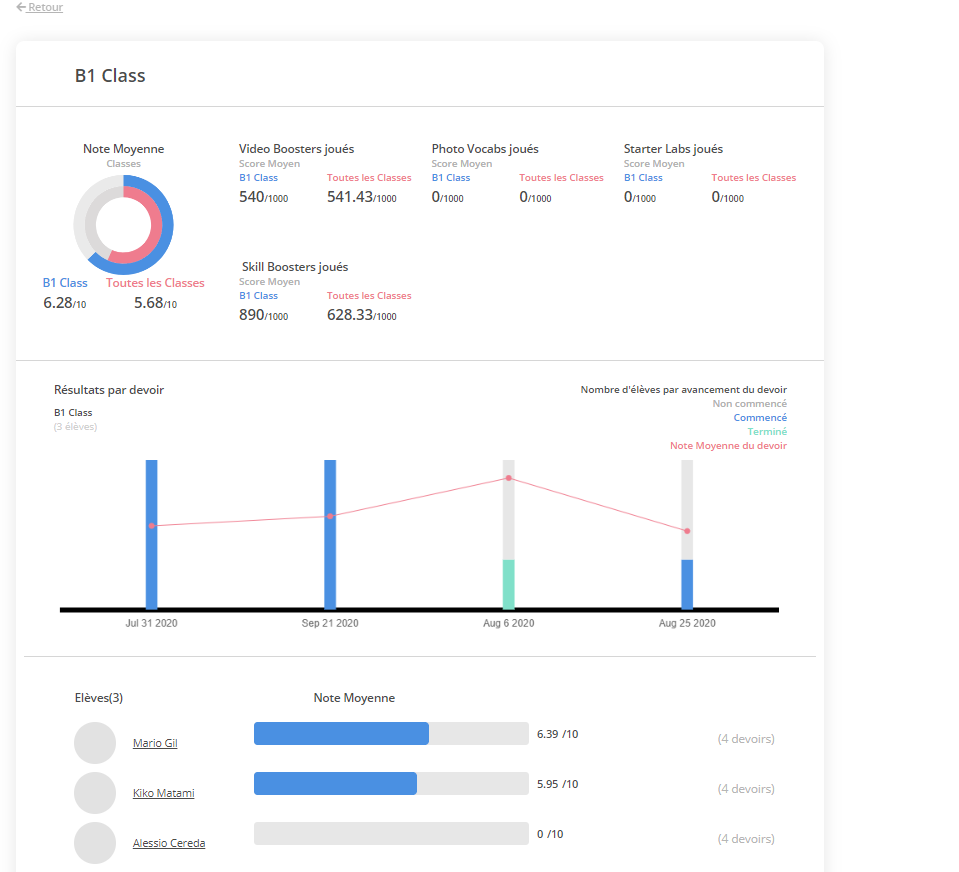
The data available on the Statistics and Results page are shown on three levels: all classes, a single class, and a single student.
If you'd like to know the performance of a specific class, click on the concerned class in the Assignment Statistics section, under the Classes heading. You can view the performance that class (in blue) against all your classes (in red), and consult the graph for an overall view of the different assignments for this class. By hovering your mouse cursor over the bars of the graph, you'll see how many students have completed to what extent (progress status) each assignment, as well as the average score obtained for each assignment. There is no correlation between average score and progress status.
Finally, this page also offers you an overall view of students' averages in the class. To learn more about the performance of a particular student, click on the student's name.
How can I track the progress of a student?
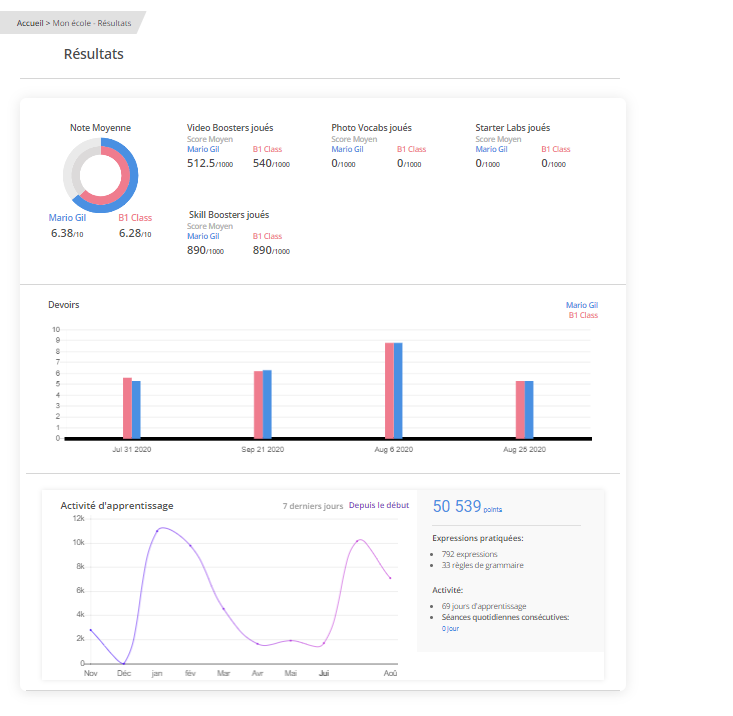
You can track a student's progress in two ways: by checking general performance on assignments, or by checking their Assessment Test results.
To check the general performance on assignments, go to the Assignment Statistics section of the Statistics and Results page, click on the concerned class, then click on the student in question. Note that this is the same page the students consult to find out their performance. Here you'll find the same information you'll also find at the class level (general average, average result per learning unit, average result per assignment). All these averages are stacked against those of the entire class, to help both you and the student know where he or she stands among the rest of the class, and on which types of learning units is the performance strongest and weakest.
The last graph on this page shows the student's activity on the site: the number of points earned per day as well as lifetime number of points, number of expressions learned (these are available for review in the Expressions Learned dashboard), grammar rules learned, the number of days the student logged in for a session, and time spent on the platform.
To learn more about Assessment Test results, go to the Test Results section of the Statistics and Results page. If the list of test results is very long, you can find a specific student by entering the student's name and in the search tool or by clicking on their class.
Good to know: downloadable activity reports help you stay up to speed with your students' progress.
How do I know if my students logged in?

To know if and when a student has used the platform, go to the Statistics and Results page. On the web version of Do you speak Jeun'Est, from the bottom part of the Statistics evaluation section, you can download a user statistics report where you'll find:
- the number of connections (log-ins) during the specified time period
- time spent on the platform
- the date of the most recent activity session on the platform
You can also consult a smaller set of usage statistics for each student on the Results section of the Statistics and Results Page.
How do I download results and statistics for a specific class?
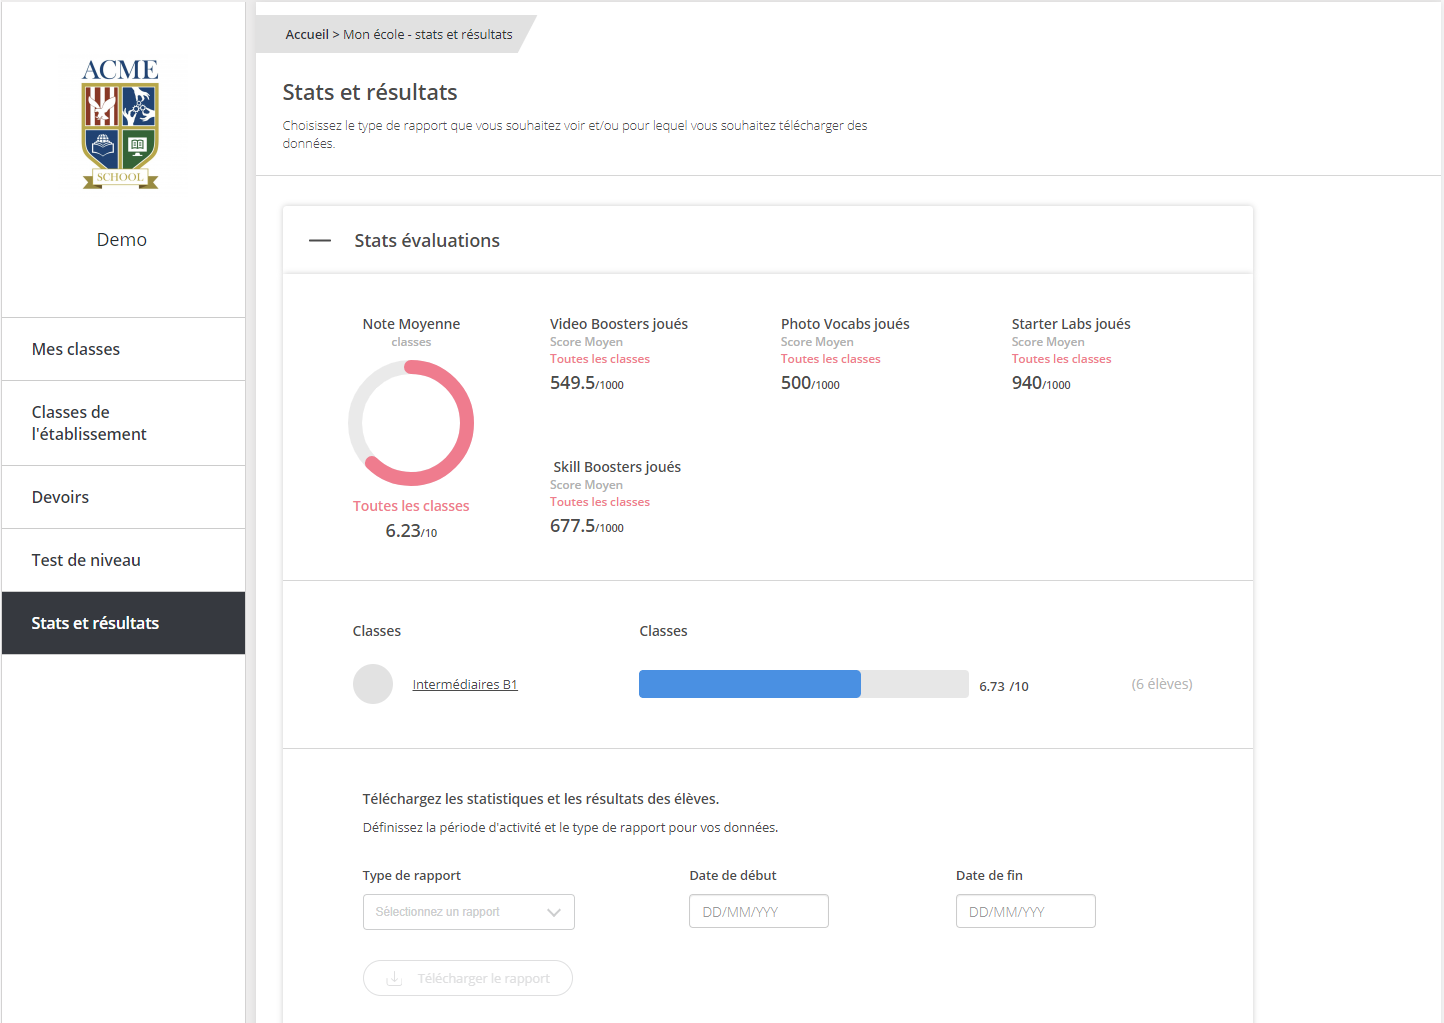
You may be interested in three types of statistics: usage statistics, assignment results and Assessment Test results. These reports will help you track and record the progress of your students and your classes in general.
Statistics reports keep you informed on activation codes (if necessary), Do you speak Jeun'Est usage statistics (number of connections, total time spent on Do you speak Jeun'Est, most recent activity session), the scores obtained for each learnng unit, and the Assessment Test results.
Assignment results show the score each student obtained in your assignments: their overall score over 10, and their score for each learning unit of the assignment.
Assessment Test results show the student's level in line with the CEFRL. Each report shows up to 10 of the latest results obtained by your students in the Assessment Tests.
Usage statistics and assignment results can be exported in .csv format in the Statistics evaluation section of the Results and Statistics page.
Assessment Test results can be exported in .csv format in the Test Results section of the Results and Statistics page. Once downloaded, you can process the data as you wish.
Good to know: each report is dated for easy sorting.

